
BATIXT EIS SCANNING PRODUCTS
COMING 2025
PRODUCT DEVELOPMENT
Batixt are developing a range of R3 EIS Scanning products for application on batteries (typically Lithium-Ion) of varying formats and chemistries.
The first EIS Scanners applying Batixt unique and powerful EIS Sensing Technology will be on the market during 2025 and are designed for cells in the range of 2.5 – 5 V. The capacity and impedance of the battery will determine which instrument is suitable.
The Scanners will be capable of evaluating the following common cell formats:
- Coin Cells
- Cylindrical Cells
- Pouch Cells
- Prismatic Cells
Batteries come in different voltage ranges, which is also influenced by the type of battery chemistry. Further on EIS Scanning Instruments for other voltage ranges will be developed. Initially to cater for 12-48V and thereafter for higher voltages. This will extend capabilities to the following formats:
- Modules
- Packs
- EV Packs
Below you can see the key features of our EIS Scanners outlined.
Also, the preliminary specifications for our EIS Scanner Clarity for evaluation of (typically cylindrical) cells from 1-10 Ah.
KEY FEATURES
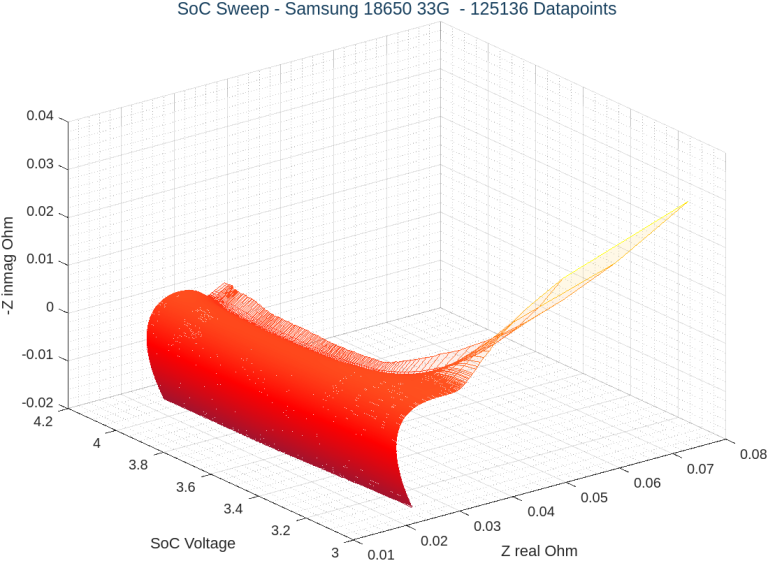
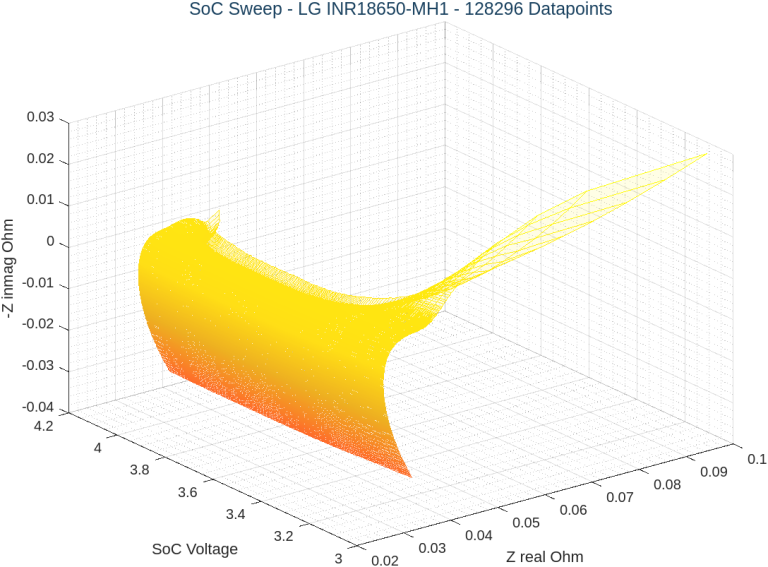
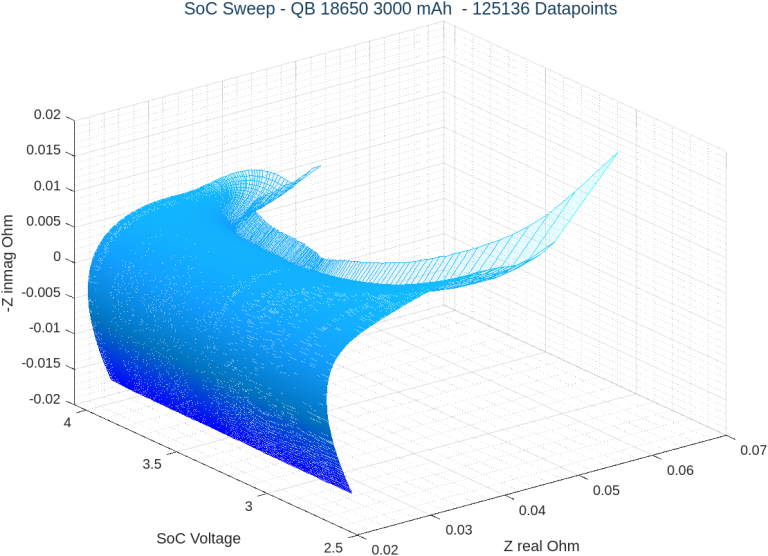
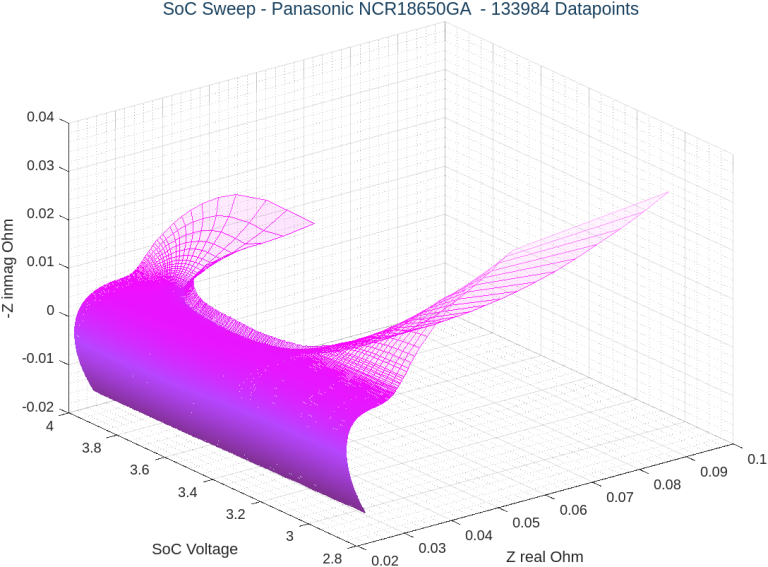
R3 EIS SINGLE SCANS OR MULTI-SCANS (SOS Sweep with multiple EIS Scans)
- Multi-sine EIS scans with hundreds or thousands of frequencies in a single measurement
- Charge or discharge cycling of batteries
- User-friendly script editor where you can design your own cycling and measurement protocols
- Choose fixed measurement times of 21, 42, 84 or 168 seconds) or specify your own
- Specify current settings and frequency separation yourself or use default settings
- EIS (Nyquist), Step Response and Relaxation data output on request
- Choose between data output formats (including MATLAB)
- View Nyquist single or multi-scan plots
INTERFACES
- Battery connection
- Computer connection
- Power supply connection

| SPECIFICATIONS FOR EIS SCANNER CLARITY | |
|---|---|
| CURRENT AND VOLTAGE | |
| Battery Capacity (Ah) | 1 to 10 Ah (dependent on the batteries imepdance). Accuracy is reduced outside this range |
| Battery Voltage (V) | 2.5 - 5 V |
| Applied Current (A) | 0-5 A (DC level up to 2.5A) |
| The current can and should be selected depending on the battery properties | |
| Drawn Current (A) | 0-5 A (DC level up to 2.5A) |
| The current can and should be selected depending on the battery properties | |
| Calibration | Yes |
| EIS MEASUREMENT | |
| Measurement Method | Galvanostatic, on charge or discharge |
| Frequency Range | 10 mHz - 10 kHz |
| Number of Frequencies | User defined prameters of measurement time and frequency separation determine the number of frequencies in a single multi-sine measurement A 42 second EIS scan, with a frequency separation of 1% delivers EIS results for approximately 630 frequencies |
| Frequency Resolution | Few ppm of the setting |
| Quality Indicators | Scatter is calculated and displayed. Due to high data resolution, scatter can be observed in the Nyquist diagram. Parasictic frequencies will stand out clearly |
| Measurement Accuracy | Since both the current and the voltage used to calculate the EIS data are measured by the same device, we become independent of absolute accuracy while relative accuracy between current and voltage is maintained at a high level The time constant spectrum data can be used to further enhance accuracy in the modelling phase |
| Modelling Accuracy | In modelling that is based on EIS data from this instrument, each modelled parameter may be based on a large number of EIS data points, typically 50 or more points. Therefore, the resulting parameters become very accurate |
| Output | Nyquist data (separated from step response) |
| Step response data | |
| Relaxation information | |
| DATA ACQUISITION | |
| Method | Single EIS scan or multiple scans via user defined script |
| Rate (Sampling) | 200 kHz, 18 bits, The sampling rate will decrease for data acquisition times exceeding 200 seconds |
| Time | Fixed times of 21, 42, 84 or 168 seconds can be selected. These times ensure fastest data processing. Other measurement times may be selected, but will result in slower dataprocessing |
| Measurement Resolution | 0,0005 % of full range including oversampling |
| Noise and Ripple | Levels are low The signal-noise ratio varies depending on the measurement time, the number of frequencies and the current applied The scatter value that is displayed together with the appearace of the Nyquist diagram reveals the noise levels There is no ripple in the discharge analysis since the power is from the battery. In the charge analysis there is XX mV noise/ripple from the 7 VDC power supply |
| HARDWARE/SOFTWARE | |
| Filters | Hardware/Software |
| Interfaces | Ethernet (Direct, LAN) |
| USB 2.0 and 3.2 with integrated computer | |
| Battery Cycling | The software makes it possible to design and perform cycling procedures. See the operators manual for more details on the capabilities |
| Power | Requirement: Max. 100 W at 230 V AC Power Supply: 1. Internal ± 15 V 2. 7 VDC to drive current into the battery and to charge the battery |
| Dimensions | 380 (L) x 270 (W) x110 (H) mm |
| Weight | 7-8 kg |
| Cell (Electroces) Connections | 4-wire battery connection |
| Input/Output | Hardware trigger signal input and corresponding ready signal output |
| Grounding | Normal safety grounding of the instrument according to CE-certification standards |